
Home | About | Context Burundian
About
National context of Burundi
About MRV
National context
Sectoral actors
Stakeholders
Burundi is actively involved in the implementation of international commitments to combat climate change. As such, the country acceded to the United Nations Framework Convention on Climate Change (UNFCCC) 25 January 1995, Kyoto Protocol 18 October 2001and ratifiedParis Agreement on 17 January 2018, andDoha Amendment 17 November 2020.
National circumstances:
Burundi's climate profile is defined by the key factors that dictate the priorities of the MRV system:
-
Geographical and Ecological Profile : A topography of mountains and plateaus influencing microclimates and biodiversity.
-
Demographic Profile : A high population density which increases the pressure on land use.
-
Socio-economic profile : An economy dominated by the agro-pastoral sector, the main driver of development but also a major source of vulnerability.
-
Sanitary and Epidemiology Profile : Particular attention to the impact of climate on public health.
Burundi is a country located on the borders of Central and East Africa. Its area covers 27,834 km2 of which 25,000 km2 is land. Its geographical coordinates are: (i) Longitude: 29.00° and 30.54° East; (ii) Latitude: 2.20° and 4.28° South.
It is surrounded in the North by Rwanda, in the East and South by the United Republic of Tanzania and in the West by the Democratic Republic of Congo. According to the new administrative division (2025), Burundi currently has 5 provinces and 42 communes.
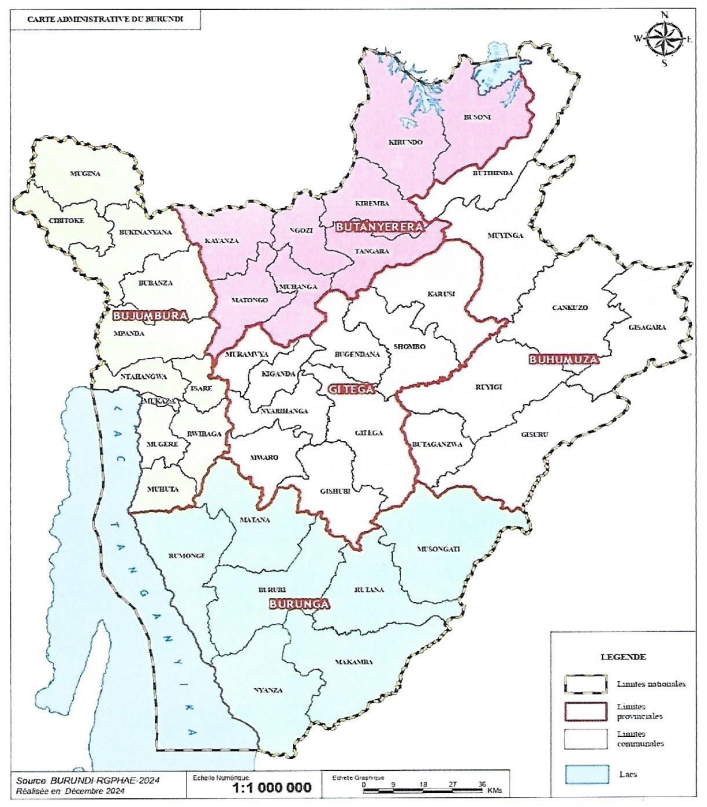
Burundi administrative map with 5 provinces and 42 municipalities
Agriculture remains the predominant activity in Burundi and is practised by more than 90% of the population1 and occupies 50% of the land area of Burundi2. The average size per holding is 0.5 ha.
The mapping of land use in Burundi of 1990-2022 carried out by the OBPE in 2024 allowed to give the areas of the different ecosystems. Thus, the area of artificial forest ecosystems based on Eucalyptus, Pinus, Cupressus and Callitris (a little over 7% of the national territory) is estimated at 187,740 ha, that of other forested land at 57,540 ha and that of natural forest ecosystems at 77,516 ha
Terrestrial and aquatic ecosystems in Burundi (2024)
| Ecosystem types | Area (ha) |
| Agricultural ecosystems | 2 017 281 |
| Artificial forest ecosystems based on Eucalyptus, Pinus, Cupressus and Callitris (just over 7% of the national territory) | 187 740 |
| Other forested land | 57 540 |
| Natural forest ecosystems | 77 516 |
| Pastures | 110 547 |
| Peatlands | 7 854 |
| Lakes and rivers | 227 877 |
| Establishments | 34 786 |
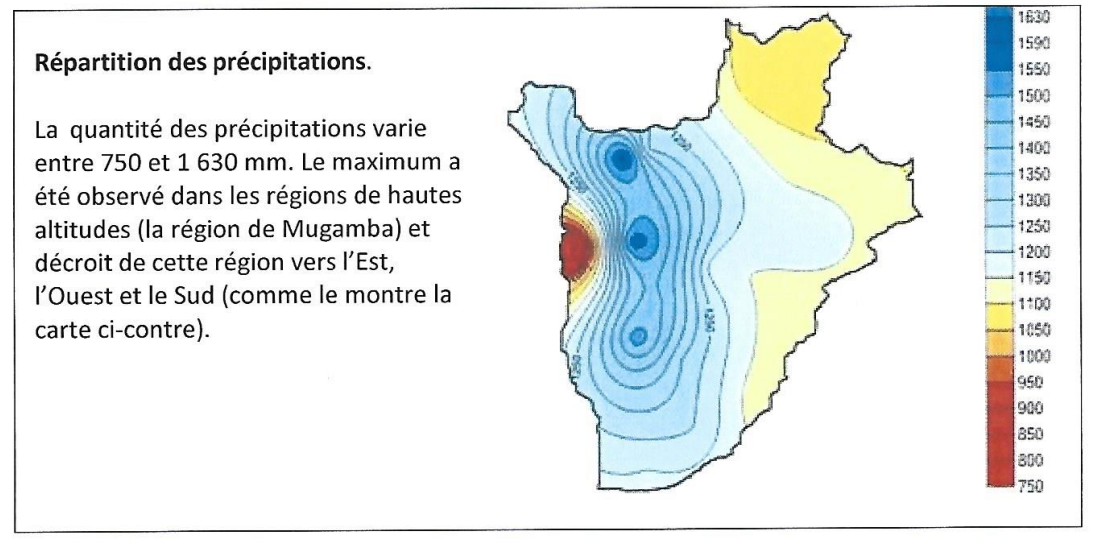
Burundi has five (5) eco-climatic regions: the western plain of Imbo, the Mumirwa escarpments, the Congo-Nil Crete, the central plateaus, the Kumoso and Bugesera depressions. They are shown in the figure below.
The distribution of rainfall and temperature according to altitude in Burundi and
eco-climatic regions are shown in the figure below.
The demographics show that the Burundian population increased from 9.4 million in 2013 to 13.1 million in 2023. In 2024, the General Census of Population, Housing and Agriculture counted 12,332,788 inhabitants, including 5,901,069 men and 6,431,719 women.
Demographic analysis is important as it provides useful information that can be used to make good decisions in businesses, government and social services, among others. It helps to understand the characteristics of a population and how it may evolve in the future, which is important for making decisions.
The total fertility rate (TFT), also known as the Total Fertility Index (SLI), is a key demographic indicator that reflects the average number of children a woman would have during her reproductive life, taking into account current fertility rates by age. It rose from 5.3 in 2013 to 3.6 in 2023. High fertility (over 2.5) can lead to rapid population growth, with implications for resources and social services.
The crude mortality rate (GMR) is the number of deaths in a population relative to the total population, often expressed per 1,000 inhabitants over a given period (usually one year). Analyzing and interpreting the crude mortality rate (GMR) is essential to understand the health of a population and demographic dynamics. A low BMT (below 8 per 1,000) generally indicates good public health, effective health systems and high life expectancy, while a high BMT (beyond 10 per 1,000) can report public health problems, epidemics, conflicts or other crises.
The analysis of the crude mortality rate is therefore crucial for understanding the health of a population and guiding health policies.
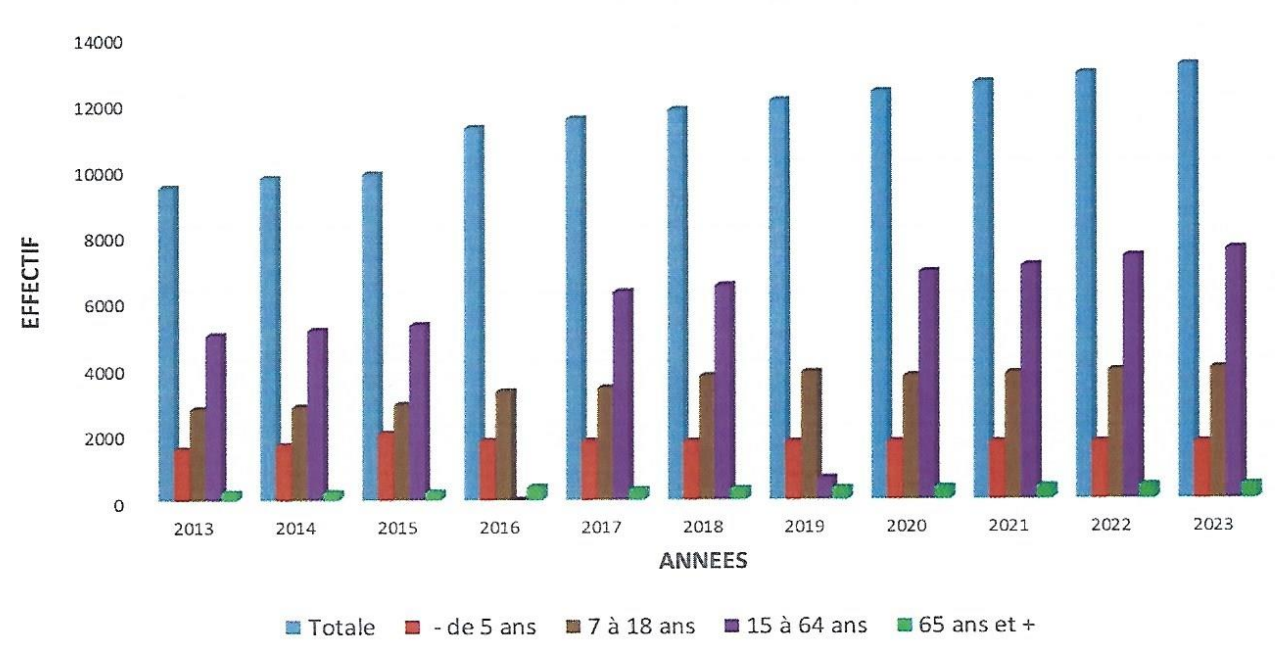
Demographic balance
The proportion of young people generally refers to the proportion of the total population belonging to a specific age group, often defined as those aged 15-24; but this may vary depending on the context. Analysis of the proportion of young people in a population helps to understand demographic issues and to plan appropriate policies.
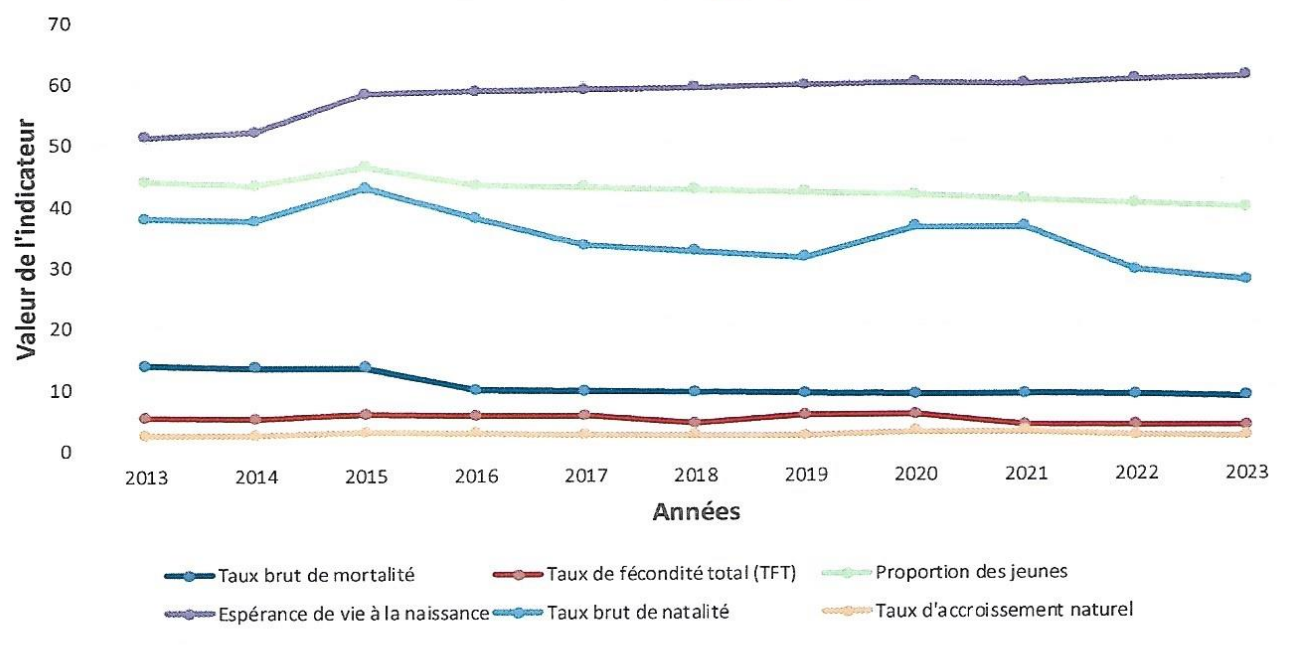
Evolution of demographic indicators
Life expectancy at birth is the average number of years a newborn can expect to live, taking into account current mortality rates by age. It is usually calculated from statistical mortality tables that take into account the mortality rates of a given generation. The analysis of life expectancy at birth provides essential insights into the health and social determinants of a population.
High life expectancy (over 80 years) generally indicates a good level of public health, medical care, nutrition and living conditions, while low life expectancy (less than 65 years) may indicate health, poverty, conflict or limited access to care.
The crude birth rate (TBN) is the number of live births in a given population in a given year, compared to the total population, often expressed per 1,000 inhabitants. Crude birth rate analysis is crucial to understanding demographic trends and planning appropriate policies. High TBNs (more than 30 per 1,000) may indicate a young population, a large family culture or lack of access to family planning methods, while low TBNs (less than 10 per 1,000) may indicate a decline in the birth rate due to factors such as urbanization, women's education, access to contraception and alternative lifestyle choices.
The crude birth rate (TBN) is the number of live births per 1,000 inhabitants of a population over a given period, usually a year. Analyzing and interpreting the crude birth rate is essential to understanding the demographic dynamics of a population.
High TBN (over 30 per 1,000) may indicate a young population, a preference for large families or a lack of access to family planning, while low TBN (less than 10 per 1,000) may indicate an ageing population, high urbanization, further education, or improved access to contraceptives.
Analysis of exports and imports of goods and services (as % of GDP) is crucial to understanding a country's economic dynamics and its position in international trade. For exports, a high percentage indicates a competitive and integrated economy, while a small percentage may indicate structural weaknesses; For imports, a high percentage may indicate economic dependence, but also diversification of choices for consumers.
The analysis of the export-to-import ratio, often expressed as a percentage, offers an important perspective on a country's economic health and position in international trade. The ratio of exports to imports (E/I) is a measure that compares the total value of a country's exports to that of its imports. In the case of Burundi, the country imports more than it exports, which may be of concern in the long term, as this can lead to a trade deficit and chronic debt. Countries that invest in innovation can see an increase in their exports.
The analysis of gross domestic investment (GII) as a percentage of GDP is essential to understand a country's economic dynamics. A high BPI suggests a robust growing economy, while a low BPI may indicate structural problems or recession. The examination of the evolution of IIB (as a percentage of GDP) over several years may reveal cyclical trends (up and down) and help identify periods of economic recovery or slowdown. Analysis of the ratio of direct taxes to total taxes (as % of GDP) is a valuable tool for assessing the structure and fairness of a country's tax system. By providing information on direct income dependency, it helps to understand how resources are collected and redistributed in the economy. A high ratio indicates a strong dependence on direct taxes, which may mean a more progressive tax system, where taxpayers pay according to their ability to do so.
The dependency coefficient is a demographic indicator that measures the proportion of the population that is dependent on the active population. It provides an opportunity to assess the age structure of the population and to analyse the economic pressure that the dependent share of the population may represent on the labour force. It also enables demographic and economic developments to be monitored over time. A high coefficient may indicate the need for increased investment in health care and education.
Household final consumption represents household expenditure on consumer goods and services. High consumption may indicate strong domestic demand, which stimulates production and economic growth. Stable consumption can signal a resilient economy, while large fluctuations can be synonymous with instability.
Analysis of the annual rate of inflation is crucial to understanding a country's economic challenges. It provides guidance on household purchasing power, economic policies to be adopted, and the general state of the economy. Careful monitoring and understanding of factors affecting inflation are essential for economic decision-makers and investors.
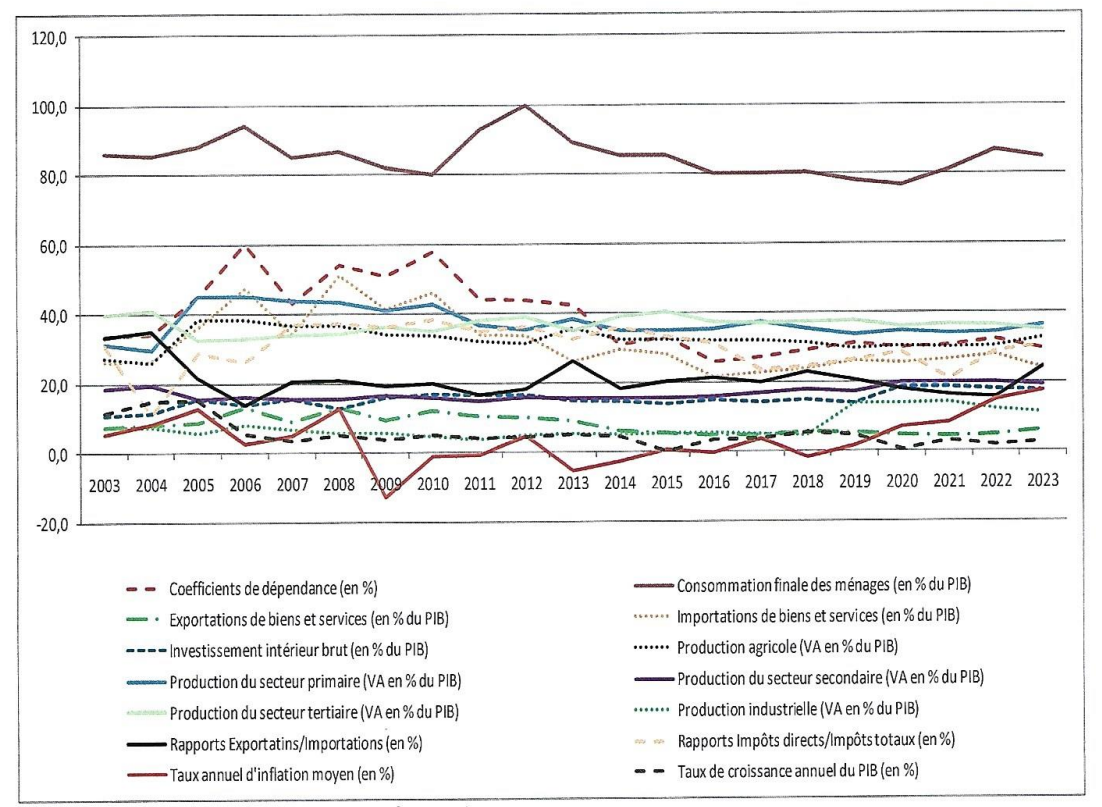
Development of socio-economic indicators
The epidemiological and health profile of the country is characterized by the recurrence of cholera and measles epidemics, as well as the prevalence of malaria, tuberculosis, HIV/AIDS and malnutrition in some communes of the country.
In 2024, the national incidence rate of malaria was 458.3 cases per 1,000 inhabitants and pregnant women and children under the age of 5 are the most affected population.
From January 2023 to October 2025, the country is in cholera epidemic with a cumulative of 2,800 cases and 17 deaths. The SMART 2022 survey estimates the overall rate of acute malnutrition among children under 5 to 4.8%. The areas most vulnerable to malnutrition are those located in the North Depression, Central Plateaux, the Congo-Nil Crest and the Plaine de l'Imbo.
The various risk assessments carried out at the national level have highlighted the fact that the outbreak of cholera, malaria and malnutrition in high-risk municipalities is strongly related to the effects of climate change faced by the country, which manifests itself in some communes by heavy rains leading to stagnant water sources of disease, or a prolonged sunshine which causes a water deficit which causes a decline in agricultural productivity in the central plateaus and depressions of Kumoso and Bugeresera (locations of northern and north-eastern Burundi).
Risk Profile and Vulnerability
Burundi faces specific climate challenges that the MRV monitors:
-
Disaster risk : Flood monitoring, landslides and cyclical droughts.
-
Vulnerability factors : Analysis of community resilience to climate shocks.
Burundi has a multi-hazard national mapping system to assess in an integrated manner the main natural and climatic hazards that cause disasters affecting its territory. This mapping is carried out nationally and covers all the provinces of the country. It combines the dimensions of hazard, exposure, vulnerability and probabilistic risk in order to identify the areas most exposed to disasters. It takes into account the main climatic and geophysical hazards, including floods, torrential rains, landslides, violent winds and earthquakes. The results, produced by more than a hundred provincial maps and a national multi-hazard map and risk atlas, are a reference tool for development planning, land-use planning and the systematic integration of disaster risk into public policies.
An interactive digital platform, hosted by the University of Burundi and accessible at https://georisques.ub.edu.bi/#/, makes it possible to view, view and download these data, thus facilitating evidence-based decision-making and prioritizing disaster risk adaptation and reduction actions at the national and local levels.
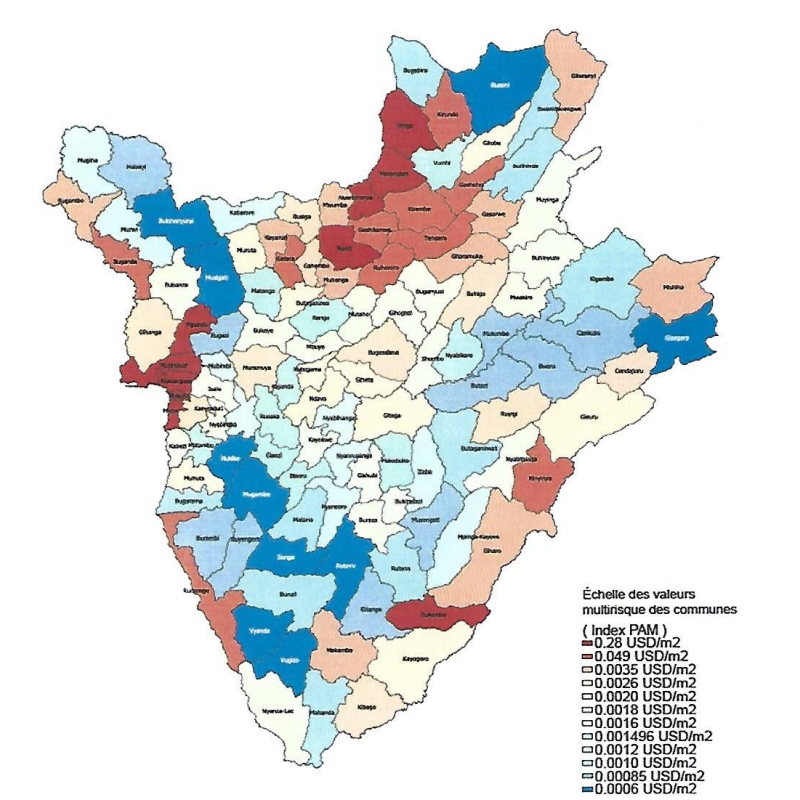
Multi-hazard mapping
According to the publications of the national disaster risk management platform, the impacts of climate change and disasters are enormous. They highlight the typology of disasters (torrential rains, floods, hail, landslides, violent winds), people affected from 2018 to 2025 (more than 1,103,773 with 201,396 displaced persons, 166 deaths) and various destructions (more than 20,225 houses and 895 classrooms completely destroyed).
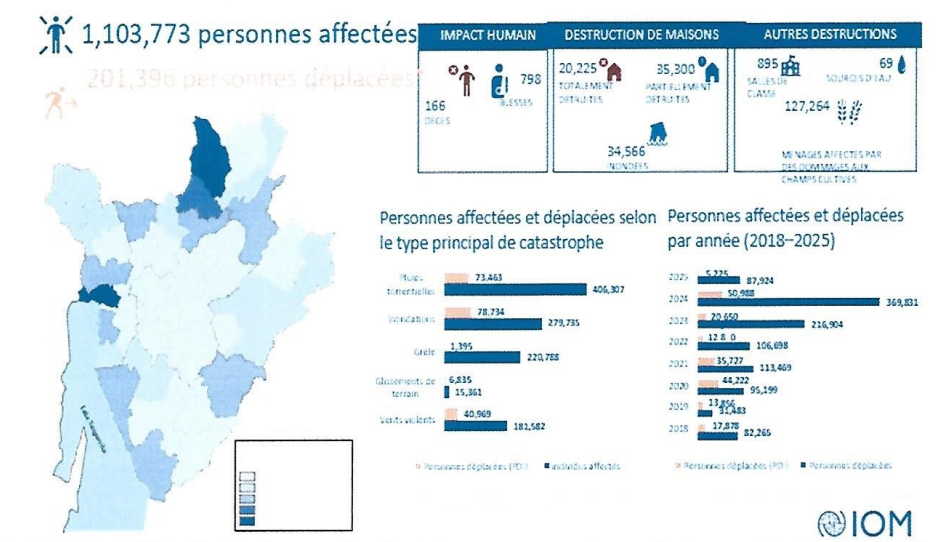
Impacts of climate change and disasters in Burundi
Key vulnerabilities identified include:
1. Dependence on agriculture A large part of the population depends on agriculture for its subsistence, making it particularly vulnerable to climate impacts. Indeed, the agriculture sector contributes on average to 39.4% of Gross Domestic Product (GDP) and provides more than 86.1% of total employment (although it is mainly informal and seasonal) compared with 10.4% for services and 3.5% for industry (PND Burundi 2018-2027 revised and PAP 2023-2027).
2. Poverty: The high level of poverty in Burundi limits the capacity of communities to adapt and be resilient to climate change, making it difficult to access adequate resources and technologies.
3. Limited infrastructure : insufficient infrastructure, especially in rural areas, making it difficult to manage the risks associated with extreme weather events.
4. Awareness-raising and educationLack of awareness, knowledge and training on climate adaptation practices may limit the ability of communities to respond effectively to climate change.
5. Increasing vulnerability for specific groupsWomen in particular, heads of households, persons living with disabilities, Batwa, young people, children (schooled or not), as well as displaced, migrant or relocated/repatriated persons, are particularly vulnerable and the degree of vulnerability increases with climate change. These groups are supported by the community, the administration and NGOs. These groups must be made aware of the impacts of climate change and be more involved in community development, risk prevention and mitigation, and climate change mitigation and adaptation; In particular, they need material and financial support, for example through the creation of AGRs (income-generating activities).
The combination of these impacts, risks and vulnerabilities underlines the need for a strong framework for climate adaptation in Burundi. This includes investments in sustainable agriculture, anti-erosive control, water resource management, the value chain and market access, community awareness and involvement, and building infrastructure to improve resilience to the effects of climate change. Concerted efforts at the local, sectoral, national and international levels are essential to address these challenges.